Colorado · CDPHE dataset
Colorado Radon Levels by County (CDPHE Data, 2005–2025)
Across all 64 Colorado counties, 46.4% of pre-mitigation home radon tests came back at or above the EPA action level of 4 pCi/L, based on 237,408 tests collected by the Colorado Department of Public Health and Environment between 2005 and 2025.
The data is sliced to county level — no individual addresses, no personally identifying information. EPA recommends mitigation at 4 pCi/L. Counties with elevated medians and large test counts warrant testing in real-estate transactions and seasonal retesting in occupied homes.
Statewide risk map
One-page handout summarizing all 64 counties — preview below, full PDF in the Downloads section.
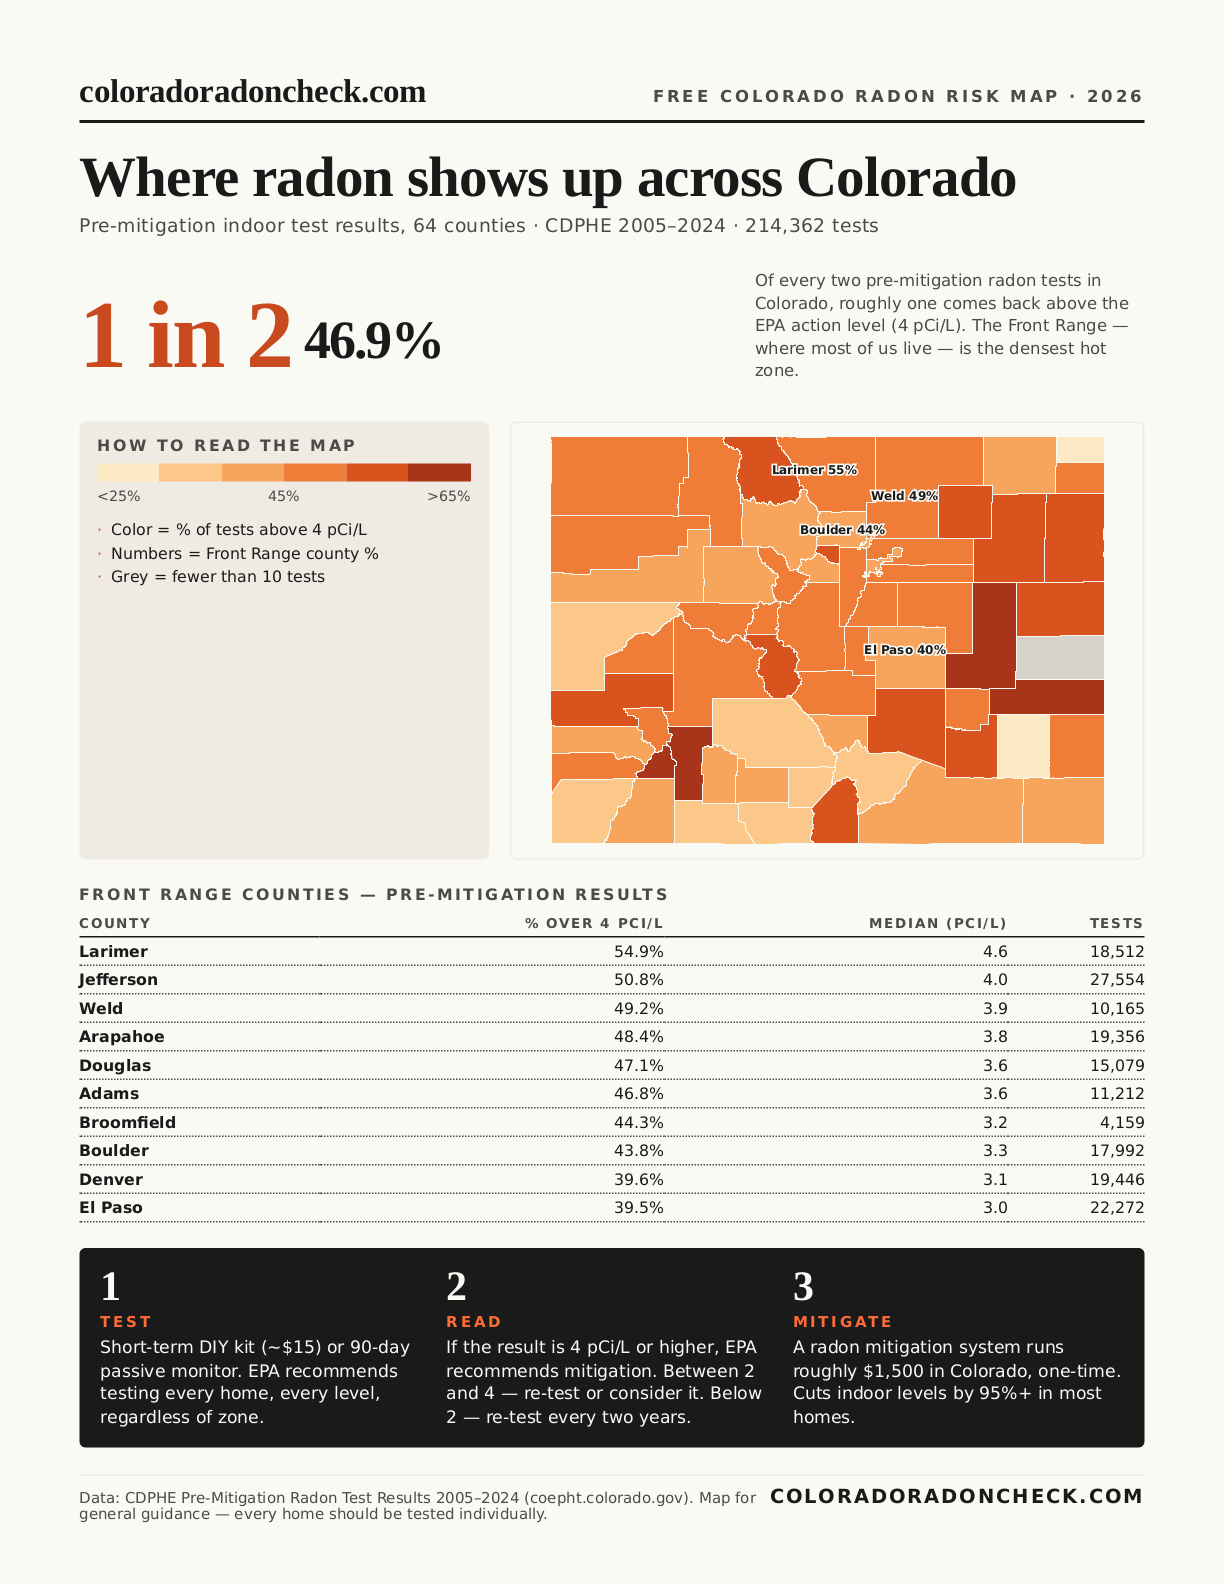
Map preview · interactive choropleth coming in a later release
Every Colorado county, sortable
Click any column header to sort. Click again to flip direction. Click a county name to see its detail page.
| Kiowa | 18 | 66.7% | 4.6 | 251 |
| MorganFR | 354 | 64.1% | 5.1 | 236 |
| San Juan | 108 | 63.9% | 5.3 | 61 |
| Pueblo | 6,260 | 63.2% | 5.7 | 279 |
| Jackson | 46 | 60.9% | 5.05 | 22.2 |
| Otero | 157 | 58.0% | 4.7 | 114 |
| Cheyennelow dataFR | 7 | 57.1% | 6.1 | 14.3 |
| Chaffee | 1,624 | 57.1% | 4.8 | 250 |
| WashingtonFR | 51 | 56.9% | 4.5 | 47.3 |
| YumaFR | 100 | 56.0% | 4.3 | 160.5 |
| Montrose | 2,491 | 55.2% | 4.5 | 361.7 |
| Teller | 2,727 | 54.9% | 4.7 | 957.4 |
| Gilpin | 636 | 54.9% | 4.6 | 773.9 |
| Fremont | 850 | 54.8% | 4.8 | 110 |
| Lake | 422 | 54.7% | 4.4 | 214 |
| Delta | 859 | 54.7% | 4.5 | 209 |
| LarimerFR | 20,368 | 54.6% | 4.6 | 1146.8 |
| Costilla | 26 | 53.8% | 4.4 | 21 |
| ElbertFR | 1,031 | 53.4% | 4.2 | 240 |
| Hinsdale | 88 | 53.4% | 4.65 | 273.1 |
| Moffat | 266 | 52.3% | 4.1 | 180 |
| Routt | 2,753 | 51.7% | 4.2 | 276 |
| Rio Blanco | 193 | 51.3% | 4.1 | 143.6 |
| JeffersonFR | 30,229 | 50.3% | 4 | 510.7 |
| Ouray | 305 | 49.5% | 3.8 | 230 |
| Park | 1,064 | 49.0% | 3.8 | 338.1 |
| Kit CarsonFR | 141 | 48.9% | 3.8 | 20.8 |
| WeldFR | 11,159 | 48.6% | 3.8 | 275 |
| ArapahoeFR | 21,419 | 48.0% | 3.7 | 369.6 |
| AdamsFR | 12,383 | 46.5% | 3.5 | 279 |
| DouglasFR | 16,872 | 46.4% | 3.5 | 274 |
| Dolores | 39 | 46.2% | 3.8 | 80.6 |
| Summit | 3,724 | 46.1% | 3.4 | 379.3 |
| Pitkin | 2,767 | 45.8% | 3.5 | 307.6 |
| Crowley | 20 | 45.0% | 3.5 | 9.6 |
| Prowers | 209 | 45.0% | 3.5 | 239 |
| Eagle | 3,845 | 44.7% | 3.5 | 235 |
| BroomfieldFR | 4,598 | 44.4% | 3.2 | 205 |
| Custer | 438 | 44.3% | 3.25 | 217.6 |
| GrandFR | 1,073 | 43.8% | 3.3 | 212 |
| BoulderFR | 19,914 | 43.5% | 3.3 | 384.6 |
| La Plata | 3,365 | 43.1% | 3.3 | 315.1 |
| Garfield | 3,243 | 42.9% | 3.3 | 276 |
| PhillipsFR | 56 | 42.9% | 3.6 | 17 |
| Baca | 54 | 42.6% | 2.9 | 208 |
| Mineral | 80 | 42.5% | 3.1 | 92 |
| San Miguel | 241 | 42.3% | 3.1 | 98.2 |
| Las Animas | 946 | 41.1% | 3.1 | 59.5 |
| DenverFR | 21,979 | 39.8% | 3.1 | 310.1 |
| Gunnison | 1,693 | 39.5% | 2.7 | 263 |
| El Paso | 25,211 | 38.6% | 2.9 | 548 |
| Clear Creek | 710 | 37.3% | 2.4 | 240 |
| Rio Grande | 428 | 37.1% | 2.7 | 336.6 |
| LoganFR | 125 | 36.8% | 3 | 18.8 |
| LincolnFR | 100 | 34.0% | 2 | 25.2 |
| Mesa | 4,318 | 33.5% | 2.7 | 301 |
| Conejos | 75 | 33.3% | 1.7 | 172 |
| Archuleta | 1,030 | 33.3% | 2.5 | 209 |
| Huerfano | 719 | 29.5% | 2 | 113.7 |
| Saguache | 203 | 27.6% | 1.8 | 74.8 |
| Alamosa | 168 | 27.4% | 2.05 | 116 |
| Montezuma | 784 | 26.9% | 2.4 | 107.6 |
| SedgwickFR | 89 | 21.3% | 1.9 | 11.7 |
| Bent | 157 | 17.2% | 0.4 | 47 |
Free radon test kits — coming soon
For Denver-metro & Front-Range homeowners: a lab-grade kit. Join the waitlist to be first in line.
Downloads
Free to redistribute under CC0. Attribution to CDPHE appreciated but not required.
Download the dataset
CSVCounty-level CSV
64 rows · 8 columns · UTF-8
Download · 2.9 KB
Colorado Radon Risk Map
One-page, print-ready handout
Download · 468 KB
How to cite this dataset
Colorado Department of Public Health and Environment. Colorado Pre-Mitigation Indoor Radon Test Results, 2005–2025. Compiled and republished by Colorado Radon Check, 2026. https://coloradoradoncheck.com/colorado/data/
- Coverage
- All 64 Colorado counties · 2005–2025 · pre-mitigation tests only
- License
- Creative Commons Zero (CC0) · public-domain dedication
- Variables measured
- Number of tests · % at or above 4 pCi/L · median pre-mitigation result · maximum recorded result
Free download
Get the one-page Colorado Radon Risk Map
All 64 counties on a single sheet — print, post, or share. We email you the PDF and an occasional Colorado-radon update.
Question about a specific county or how to read these numbers? Call us at (866) 398-9858.